


A new map showing life expectancy lets people see how long they may live, depending on their local area.
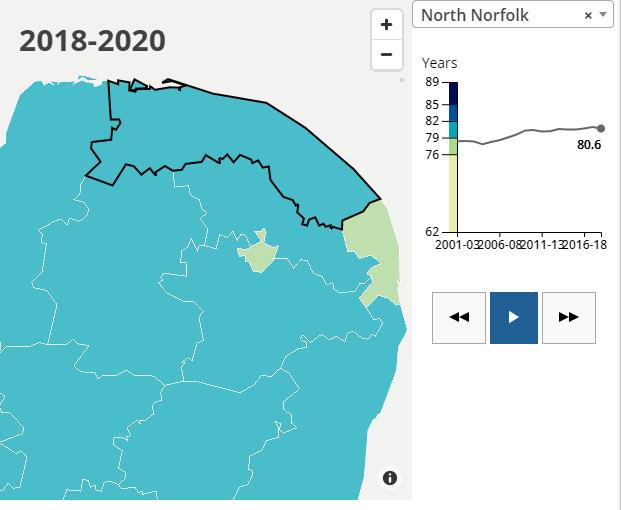
The life expectancy of a person in Norwich is 78 years, compared to a person from north Norfolk who will on average enjoy a longer life of 80.6 years.
People in Norwich and Great Yarmouth will on average die before others in Norfolk, with those in the latter expected to live until 78.5 years.
Numbers are based on children born between 2018 and 2020 and data has been compiled into an eye-opening interactive map by the Office of National Statistics.
Those living in south Norfolk are in luck, as they can expect to live the longest, for a grand total of 81.7 years.
READ: North Norfolk bucks shorter life expectancy trend
Overall life expectancy rates in the country have fallen down in the global rankings due to income inequalities.
Professor Martin McKee, from the London School of Hygiene and Tropical Medicine, said: “That rise also saw an increase in the variation in life expectancy between different social groups.
“One reason why the overall increase in life expectancy has been so sluggish in the UK is that in recent years it has fallen for poorer groups.”
Areas in England with the highest life expectancies were Kensington and Chelsea, and South Cambridgeshire.
Glasgow had the lowest life expectancy of 73 years.


Comments: Our rules
We want our comments to be a lively and valuable part of our community - a place where readers can debate and engage with the most important local issues. The ability to comment on our stories is a privilege, not a right, however, and that privilege may be withdrawn if it is abused or misused.
Please report any comments that break our rules.
Read the rules here